By Max Moreland
Working with school officials and City officials on school operations is a key component of the Spack Enterprise purpose: Improve Transportation Globally. What better way to improve transportation than to make sure kids safely get to and from their places of education? The start and end of the school day in particular can be a spot with numerous concerns and issues with the mix of walkers, bikers, buses, and cars (you can read about one of our case studies here).
 Through our work on alleviating congestion in school parking lots and the surrounding roads, we noticed what seems like a trend of more drop-offs and pick-ups compared to the bus, bike, and walking traffic. Que the grouchy, old man curmudgeon mode, where we could talk about how “back in my day parents never dropped their kids off at school. We either took the bus or walked to school; up hill, both ways, and through six feet of the snow.”
But is that true? Have the number of drop-offs and pickups at schools been increasing? Anecdotally, yes. With some schools needing to limit busing operations due to funding shortages combined with the large amount of after school activities and parents less likely to let their children walk long distances alone, it would seem likely that there are more cars going to and from schools. But what does the data tell us?
To examine this question, we consulted three sources:
- ITE Trip Generation Manual, 9th Edition: published 2012
- ITE Trip Generation Manual, 10th Edition: published 2017
- TripGeneration.org (a free service from Spack Consulting): 2018 – updated quarterly
It is important to keep in mind that rates from the different ITE manuals are compilations from over time and subsequent editions can include data from previous editions. So this is not a direct comparison between rates from completely different time periods. Rather, as data is added to the manuals, trends in the data should emerge showing whether rates are generally increasing or decreasing. The data from TripGeneration.org contains information from 2015 to today, which should reflect current rates. This data also represents Minnesota sites rather than a mix of information from across the country.
The three charts below show the rates per number of students for Elementary, Middle/Junior High Schools, High Schools. All three are where we would expect to see this trend, and conveniently correspond with data from TripGeneration.org.
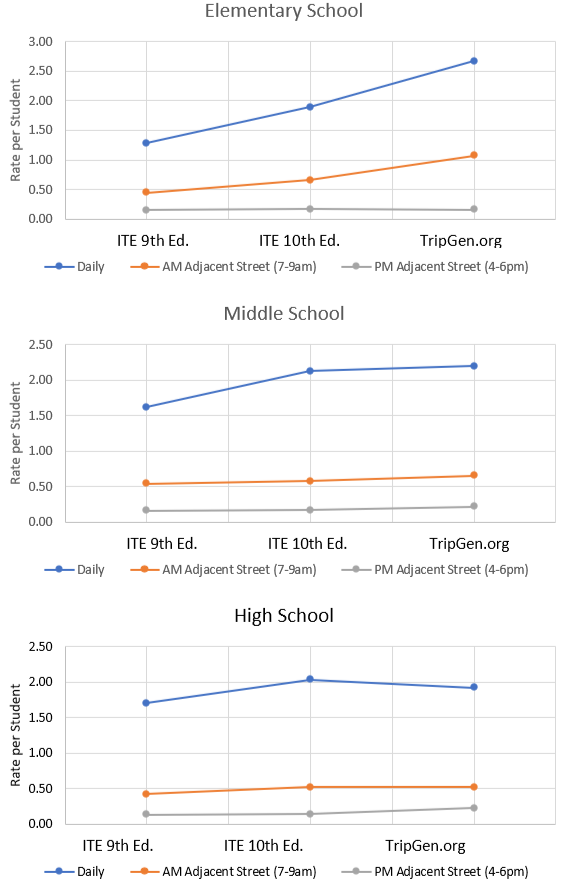
As seen in these three charts, the rates do have an upward curve – most noticeable in the Elementary School land use. We’ll take that as some evidence that we’re not crazy and more people are driving their kids to and from school. This fact can be important to remember when examining school operations, particularly older schools not designed for large numbers of drop-offs and pick-offs.
What’s your experience? How does your regional data compare to the numbers in ITE’s Trip Generation Manual? Add your thoughts in the comments below.
Free Trip Generation Data at TripGeneration.org
At Spack Consulting, we collect local data on many, if not most, of our traffic studies. And we make this professionally collected data for free. Our document includes over 13,500 hours of data and allows you to see the full 24-hour data collected. Go to TripGeneration.org to download the raw data we’ve collected. Check out our free parking generation data as well!
The post Trip Generation Review: Schools appeared first on Mike on Traffic.