

By Max Moreland, PE
In the current 10th edition of ITE’s Trip Generation Manual, the categorization for a number of land uses has changed from previous editions. One of those changes is for multi-family housing. I thought I would take a closer look at the new ITE multi-family housing land uses to see how it compares to local data we have collected.
In previous versions of ITE’s Trip Generation manual, apartments and condominiums/townhomes were separate from one another and the classification is further broken into various classifications such as height, rental versus owner and luxury versus standard. In the 10th edition, apartments and condominiums/townhomes have been combined under the same umbrella of multifamily housing.
Multifamily housing in the ITE Trip Generation Manual is now broken up into:
- #220 – Multifamily Housing (Low-Rise) – containing one or two floors
- #221 – Multifamily Housing (Mid-Rise) – containing three to ten floors
- #222 – Multifamily Housing (High-Rise) – containing more than ten floors
At TripGeneration.org, we also collected data at multifamily housing locations for the last few years. Our data has been categorized as either Townhomes or Apartments. All the townhomes we collected data at have either one or two floors and all the apartments we have collected data at have between three and ten floors.
Comparing the data we collected locally in the Minneapolis, Minnesota region for TripGeneration.org against the ITE data, our Townhome data fits neatly in the Multifamily Housing (Low-Rise) category and our Apartment data fits neatly in the Multifamily Housing (Mid-Rise) category.
The following charts compare our local Townhome and Apartment data against the three new ITE Multifamily categories.
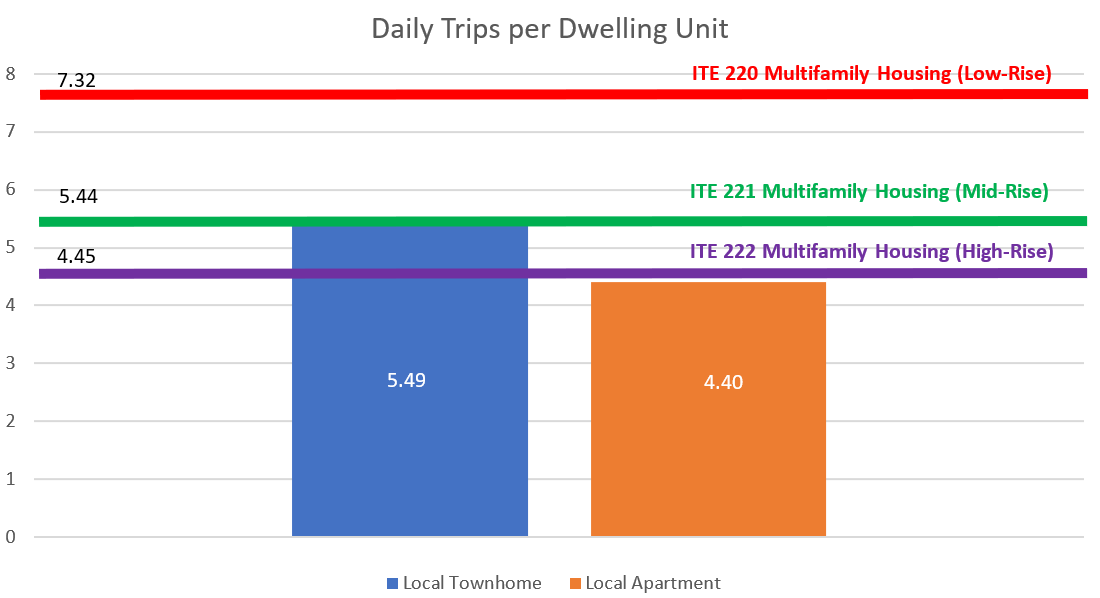
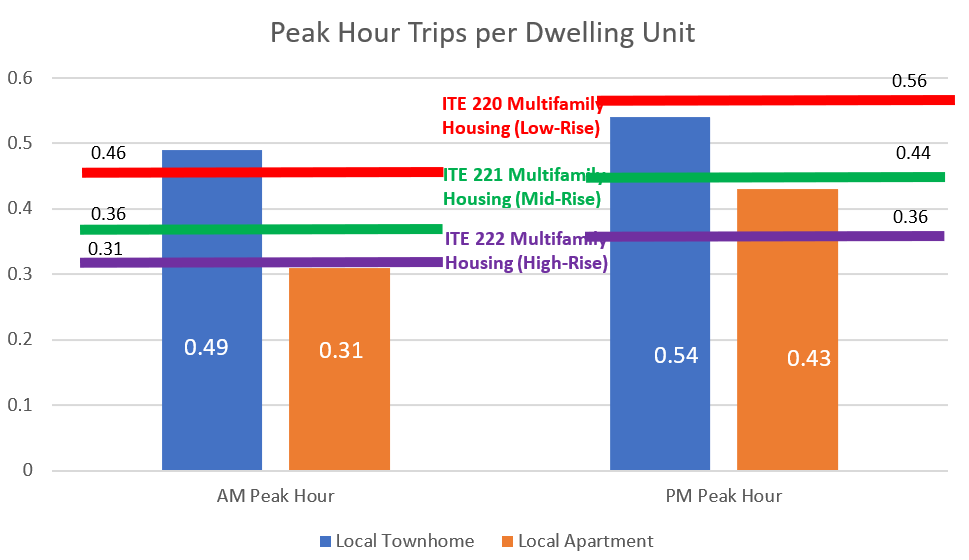
As shown in the charts, our local rates for Townhomes are in line with Multifamily Housing (Low-Rise) in the a.m. and p.m. peak hours, but the local rates are lower for the daily trips. For Apartments, our local data is in line with Multifamily Housing (Mid-Rise) in the p.m. peak hour, but the local rates are lower for the a.m. peak hour and daily trips.
[Download Free Trip Generation Data – TripGeneration.org]
While the locally collected data does not line up 100% with the ITE data, the trend is still the same between the two: as the buildings get taller, the trips per unit get smaller. The reasons behind this are multiple and varied and would take another blog post to get into, so rather than get into that, I will repeat myself because it is fun to rhyme:
As the buildings get taller, the trips per unit get smaller.
Of course, there are many factors that impact trip generation data for each of the new land uses, which is why we encourage everyone to collect trip generation for there region when preparing traffic studies.
What’s your experience? How does your regional data compare to the numbers in ITE’s Trip Generation Manual? Add your thoughts in the comments below.
Free Trip Generation Data at TripGeneration.org
At Spack Consulting, we collect local data on many, if not most, of our traffic studies. And we make this professionally collected data for free. Our document includes over 13,500 hours of data and allows you to see the full 24-hour data collected. Go to TripGeneration.org to download the raw data we’ve collected. Check out our free parking generation data as well!

The post Trip Generation Review: Multifamily Housing Land Use appeared first on .